Project: Stock Analysis Report
This project is a comprehensive stock analysis and trade selection system designed to support high-probability day trading decisions for a discretionary trader. It combines multiple layers of analysis —fundamental, technical, quantitative — to produce a structured report on any given stock. The report includes company context (country, sector, industry, ETFs), earnings calendar, news catalyst analysis with LLM-generated summaries, multi-timeframe technical analysis (for the stock, sector, and market ETFs), historical quantitative behavior (e.g., reactions to earnings, high-volume moves, and gap scenarios), and an intraday liquidity assessment benchmarked against top liquid stocks. This integrated view enables fast, informed trade filtering and execution.
https://youtu.be/gaqDWFdSK6o
Take a look inside
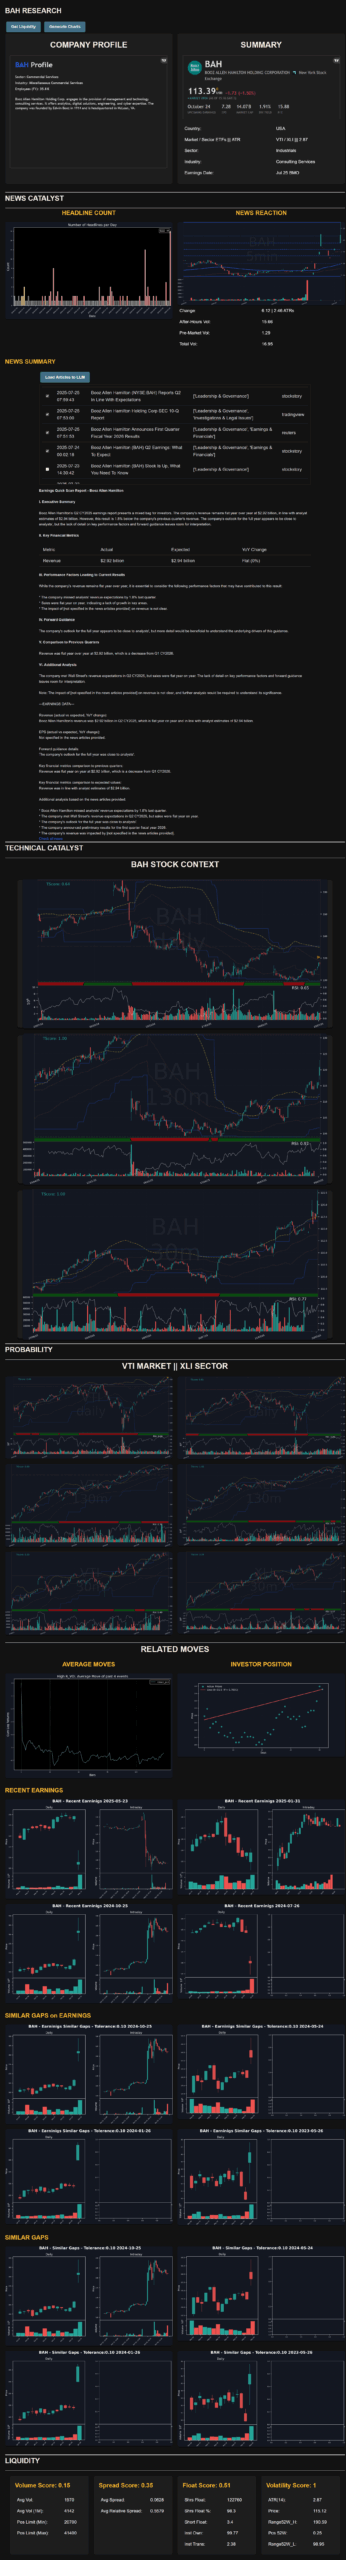
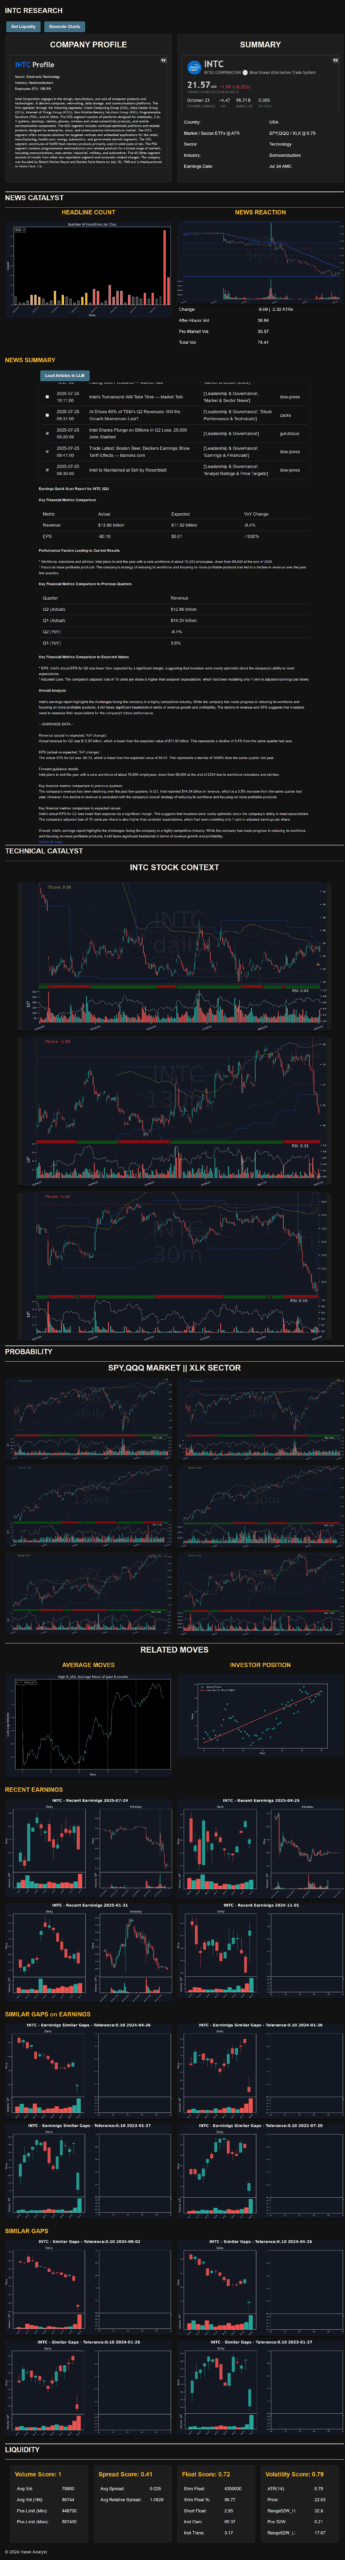
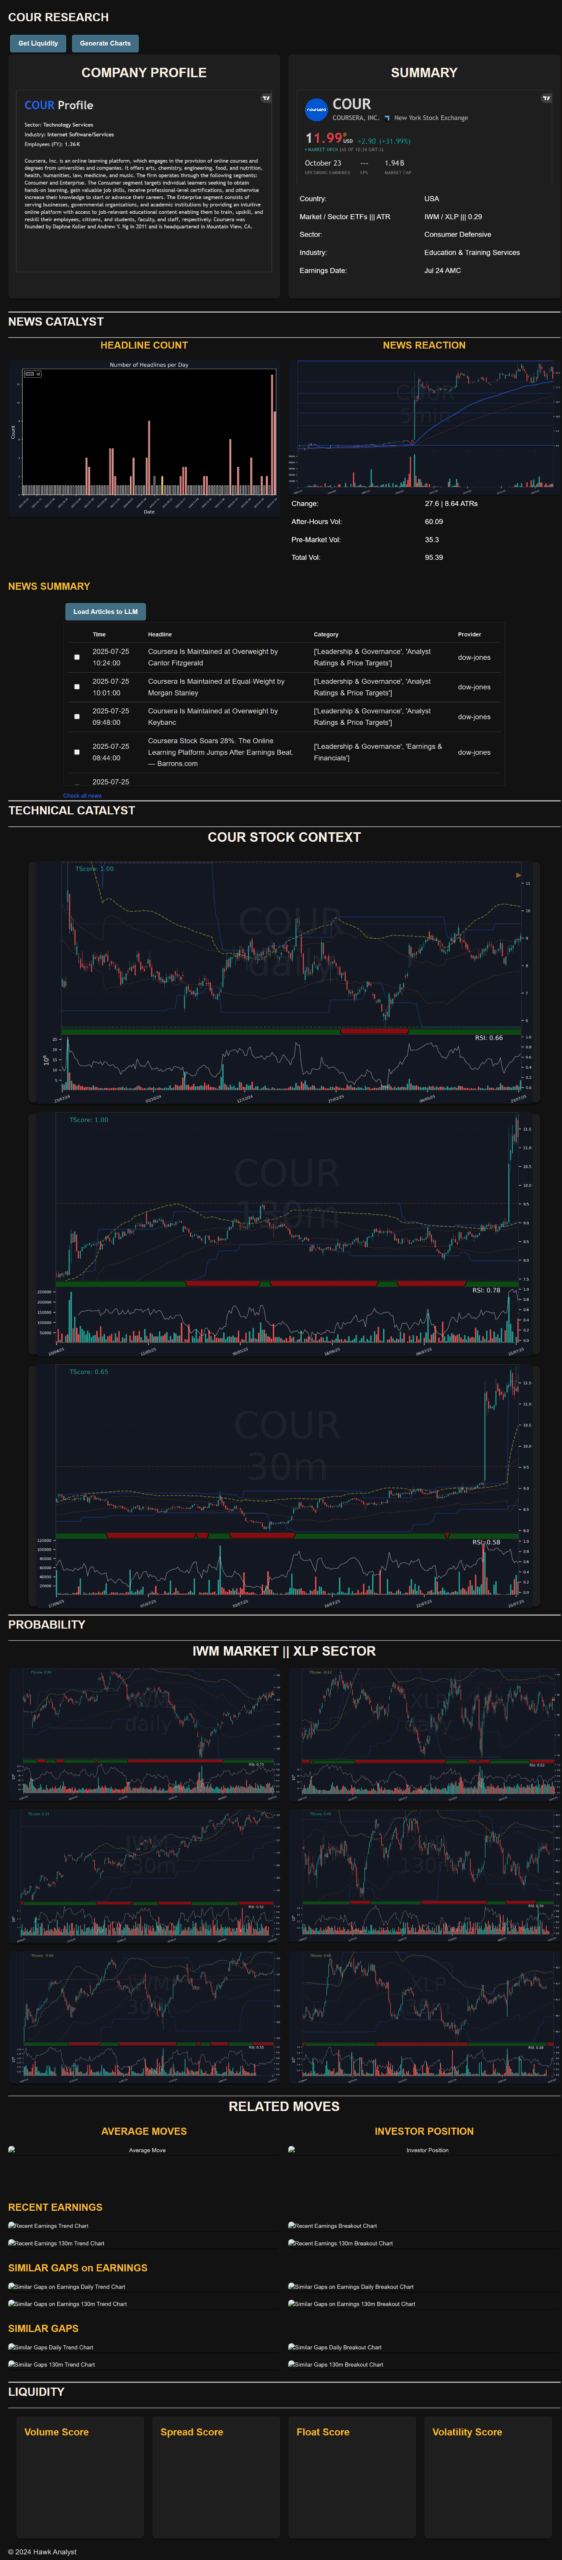
Download the image to see the full report
Technologies Used
Python:
- Front-end: flask (with HTML & Javacript
- Back-end: numpy, pandas, ollama, requests, httpx, crewai
- Data Visualization: matplotlib, seaborn, plotly
- Statistics: scipy
- LLM Models: nomic-embed-text, llama3.2:3b,mistral
Motivation
As a day trader and programmer, I needed a reliable and consistent process to screen and analyze potential trading opportunities daily. Manual research across scattered sources was time-consuming and prone to missing key catalysts or technical signals. This project was built to automate and centralize this workflow—providing a single, dynamic report that captures all critical angles of a stock’s current trading potential, while leveraging LLMs to process unstructured data at scale.
Challenges & Learninigs
-
Data Integration: Merging multiple data types (market data, financials, news, LLM outputs) into a unified and responsive pipeline.
-
Visualization Design: Creating charts and layouts that are both information-dense and easy to interpret under time pressure.
-
LLM Integration:
-
Efficient large-scale news processing using embeddings to ensure relevant summarization.
-
Advanced prompt engineering tailored to task-specific needs: factual summaries vs. insight generation.
-
Careful tuning of temperature and max token settings based on use case (e.g., low temp for extraction, higher for ideation).
-
-
Technical Strategy Automation: Encoding technical indicators and market behavior into a consistent rule-based structure across timeframes.
-
Quantitative Modeling: Designing statistical evaluations of past price action and volatility patterns specific to earnings, gaps, and volume anomalies.
-
Liquidity Benchmarking: Creating a scoring system to compare intraday tradeability and execution quality versus high-liquidity benchmarks.